Sale on canvas prints! Use code ABCXYZ at checkout for a special discount!


by Martin Krzywinski
$28.00
Design Location
Color
Image Size
Product Details
Our Bella / Canvas t-shirts are made from a 50% cotton / 50% polyester blend and are available in five different sizes. They're stylish, soft, and incredibly comfortable. Machine wash with cold water, and tumble dry on low heat.
Design Details
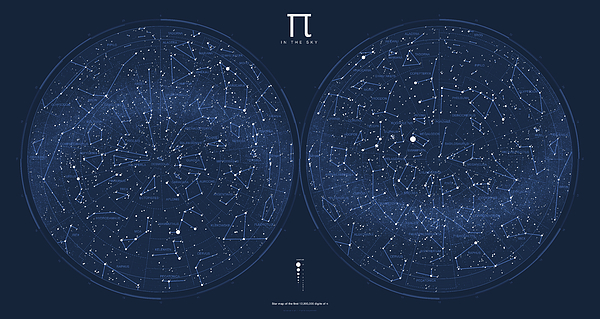
The digits of Pi are interpreted as a star catalogue. Starting from the beginning of π, each block of 12 digits is taken to be the (x,y,z)... more
Ships Within
1 - 2 business days

Digital Art

Canvas Print

Framed Print

Art Print

Poster

Metal Print

Acrylic Print

Wood Print

Greeting Card

iPhone Case

Throw Pillow

Duvet Cover

Shower Curtain

Tote Bag

Round Beach Towel

Zip Pouch

Beach Towel

Weekender Tote Bag

Portable Battery Charger

Bath Towel

Apparel

Coffee Mug

Yoga Mat

Spiral Notebook

Fleece Blanket

Tapestry

Jigsaw Puzzle

Sticker

Ornament
The digits of Pi are interpreted as a star catalogue. Starting from the beginning of π, each block of 12 digits is taken to be the (x,y,z) coordinates of a star and its absolute magnitude, which defines its brightness at a fixed distance. After sampling 12 million digits, which yields 1,000,000 stars, the stars are projected onto the celestial sphere to generate longitude and latitude coordinates from the perspective of an observer who is placed at center of the stars. The distance to the star is used to calculate the apparent magnitude�how bright it will appear on the sky chart.
Of course, a star chart would not be complete without constellations. While the digits of ππ are taken to be a universal catalog of stars, it is up to the observer to subjectively interpret the patterns and find stories in the sky. Among the 40,000 stars drawn in the chart, 80 extinct species are honored as constellations�creatures range across time periods and geographica...
As a scientist, it is my responsibility not only to present work clearly, but to connect broadly by sparking imagination and enthusiasm for inquiry and understanding. To do this, science communication must engage both cognitively and emotionally. I try to make people think and feel good by creating visualization tools and information graphics that combine analytical clarity with an artistic dimension. During my work on cancer genomes, I created Circos, now a community standard for displaying information in this field. More recently, I introduced a method for rationally visualizing networks using hive plots. My information graphics have appeared in the New York Times, Wired, Scientific American and on covers of books and...
$28.00


Ukrainian Artists
Wonderful work, Martin! Congratulations on your sale!
Artist Nandika Dutt
Congratulation on sale announcement and great.
Bill Cannon
Congrats on your sale!!!!!
Solomon Barroa
Congrats on your sale. Awesopme work.